A Manifesto for Responsible Design
Andy McGowan: Design Context
Friday, 4 June 2010
Monday, 31 May 2010
GDS Digital
GDS Digital is a company that specialises in making info graphics for websites and articles. Below is some of their work I believe is a good example of data visualisation.
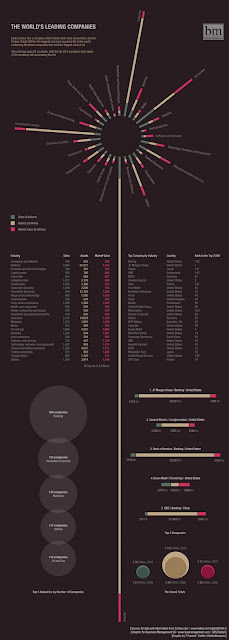
The World's Leading Companies
This graphic was created for Business Management and looks at the top companies in the world on the the Forbes Global 2000 list and breaks them down into industry and sectors, looking at how much money is made in which fields.
The World's Leading Companies
This graphic was created for Business Management and looks at the top companies in the world on the the Forbes Global 2000 list and breaks them down into industry and sectors, looking at how much money is made in which fields.
The large yellow line down the graphic isn't there as a margin between the 2 columns but actually part of the diagram at the top for the banking sector, demonstrating the grip the financial sector has on the world. This can be seen online along with it's accompanying article on Business Week: http://www.busmanagement.com/news/the-worlds-leading-companies/
Gulf of Mexico Oil Spill
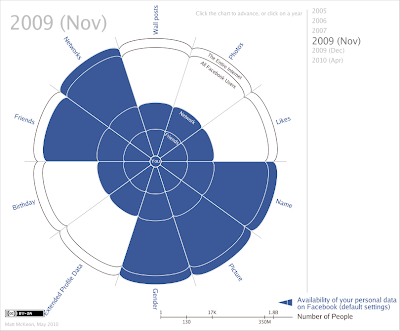
The Evolution of Privacy on Facebook
For the Imbalance brief I have been looking at data graphics. Below are a set done by Matt McKeon, a developer working with the Visual Communication Lab at IBM Research. They document the how Facebook's privacy policies have changed over the years and how newer default settings grant access to different data sets on your profile:
A scary thought indeed to see how your data has spread through the years, however a nice example of data visulisation. Simple, effective, clean.
An interactive version of this can be seen on McKeon's website: http://mattmckeon.com/facebook-privacy/
Voting Turnout – Age & Gender
While researching election turnout, I came across a study by the University of Essex looking at voter turnout by age and gender. I thought it would be interesting to include to see if comparisons can be made between different variables of voting groups.
(Available from: http://www.statistics.gov.uk/STATBASE/Expodata/Spreadsheets/D5204.xls)
Voting Turnout Statistics
As one of my FMP briefs I have chosen to do ISTD's Imbalance brief from this year's award briefs. I have chosen to do this brief as it provides a good opportunity to work with a political theme within my work.
Following this year's General Election I have decided to look at voting turnouts and the idea of 'my vote doesn't count' attitude towards voting. As this is an ISTD brief it asks for a typographical interpretation of fact, so I want to also couple this with statistics to give me the opportunity to incorporate some information/data graphics into the project. I have started looking at turnout results for the UK general election to get me started with some figures to work with.
Here are turnout results for the UK General Election from 1918 to 2001.
(From the House of Commons Library Research Paper 04/61 - 'UK Election Statistics 1918-2004', page 17. Available from http://www.parliament.uk/documents/commons/lib/research/rp2004/rp04-061.pdf)
Below are turnout statistics since 1945, covering up to the 2005 election.
(From International IDEA (The International Institute for Democracy and Electoral Assistance). Available from: http://www.idea.int/vt/country_view.cfm?CountryCode=GB#parl)
A lot of the official documentation from these sites hasn't been updated to include this year's election but BBC is reporting 65.1% turnout. (Available from: http://news.bbc.co.uk/1/hi/uk_politics/election_2010/8672976.stm. I feel this number is safe to trust due to the Electoral Commission suggesting the BBC as a source while they verify results themselves: http://www.electoralcommission.org.uk/home)
I now have General Election turnout results from 1918 up until this year's 2010 election. The 1918 election was the first election after the The Representation of the People Act 1918 that widened the right to vote to virtually all men and women over 30 that met certain minimum property qualifications and so is seen as a milestone year from the political process in this country, however I will be concerning myself with the results from 1928 onwards where women's suffrage was brought inline with that of males, enabling all citizens 21 and over to vote – a truer definition of electoral quality.
Sunday, 30 May 2010
Design Context: Books
Some of the books I got out for my Design Context publication, all around design ethics and sustainability.
Subscribe to:
Comments (Atom)


